Graphics Tips (M.I.C)
$100
Features
- Tips & Tricks (Graphical Presentation)
- Graphical Guides
- Charts & Graphs
- Statistical infographics
- Informational infographics
- Timeline infographics
- Process infographics
- Geographic infographics
- Comparison infographics
- Hierarchical infographics
- List infographics
- Resume infographics
- Isometric Infographics
- Product Infographics
- Business Infographics

Graphics Tips (M.I.C)
$100Request a Call Back
Graphic tips designing creates visual representations of how to do something. You can do this in several ways. You can get tips designed with graphics that are easy to understand. This is a tailored service, so choose your topics, and we will create custom content for you.
Our Graphic Tips Designing Services:
We offer a wide range of infographic design services to help you effectively communicate complex information in a visually engaging manner.
Our services include:
Tips & Tricks (Graphical Presentation)
We create graphical presentations of various tips and tricks that your audience can easily understand. From beauty tips to cooking hacks, we can turn any trip into a visually appealing and informative infographic.
Graphical Guides
Our graphical guides help you explain complex concepts in a step-by-step format. Whether you need to explain a scientific process or a DIY project, our graphical guides can help simplify the information and make it easier to understand.
Charts & Graphs
We specialize in creating charts and graphs that help you present data in a clear and concise manner. Whether you need to display sales figures or survey results, our charts and graphs can help you effectively communicate your message.
Statistical Infographics
Our statistical infographics help you turn complex data into an easy-to-understand visual format. Whether you need to display statistical data for a research project or a business presentation, we can help you create an infographic that effectively communicates the information.
Informational Infographics
Our informational infographics help you present information visually engagingly. Our infographics can help you effectively communicate complex information from timelines to process charts.
Timeline Infographics
Our timeline infographics help you visualize events or processes over time. Whether you need to display the history of your company or the milestones of a project, our timeline infographics can help you create a visually engaging representation.
Process Infographics
Our process infographics help you explain complex processes in a step-by-step format. Whether you need to explain a manufacturing process or a workflow, our process infographics can help simplify the information and make it easier to understand.
Geographic Infographics
Our geographic infographics help you visualize information on a map. Whether you need to display sales figures by region or population data by country, our geographic infographics can help you create a visually engaging representation.
Comparison Infographics
Our comparison infographics help you compare different sets of data. Whether you need to compare prices or features of different products, our comparison infographics can help you effectively communicate the information.
Hierarchical Infographics
Our hierarchical infographics help you visualize information in a hierarchical structure. Whether you need to display a company’s organization chart or species classification in a biology project, our hierarchical infographics can help you create a visually engaging representation.
List Infographics
Our list infographics help you present information in a visually appealing and informative way. Whether you need to display the steps of a recipe or the benefits of a product, our list infographics can help you effectively communicate the information.
Resume Infographics
Our resume infographics help you create a visually appealing and informative resume. Whether you need to stand out in a competitive job market or showcase your skills and experience, our resume infographics can help you create a unique and effective representation of your professional profile.
Isometric Infographics
Our isometric infographics help you present information in a three-dimensional format. Whether you need to display a product design or a building plan, our isometric infographics can help you create a visually engaging representation.
Product Infographics
Our product infographics help you showcase your products in a visually appealing and informative way. Whether you need to display the features and benefits of a new product or the instructions for use, our product infographics can help you effectively communicate the information.
Business Infographics
Our business infographics help you present complex business information visually engagingly. Whether you need to explain a business plan or a financial report, our business infographics can help you effectively communicate the information.
Why should you choose our graphic tips designing service?
When it comes to creating high-quality infographics, look no further than our graphic tips designing service. Our team is dedicated to crafting visually stunning and effective designs that will make your tips stand out. We are committed to improving the quality of our work and ensuring that you are completely satisfied with the final product. Additionally, we understand the importance of meeting deadlines and staying within budget, so you can trust us to deliver your projects on time and with precision.
Process
- ad
- admanagement
- ads
- Automation
- DESIGN
- EPK
- graphicdesign
- graphicdesignagency
- graphicdesigncentral
- graphicdesigne
- graphicdesigner
- graphicdesigners
- graphicdesigns
- Legal
- management
- Pitch Deck Design
- platform
- Printing
- Production
- productioncompany
- productions
- productionstudio
- socialmedia
- socialmediamanagement
- socialmediamanager
- socialmediamarketing
- socialmediamarketingtips
- socialmediastrategy
- socialmediatips
- videoediting
- videoeditingagency
- videoeditingcompany
- webdevelopment
- webdevelopmentagency
- webdevelopmentcompany
- webdevelopmentservices
- writing
- writingagency
- writingcompany
Related Products
Features
- Electronic Press Media Kit
- Music Electronic Media Kit
- Clickable Press Kit
- Celebrity & Artist Press Kit
- Influencer Press Kit
- DJ Press Kit
- Speaker Press Kit
- Author Press Kit
- Songwriters EPK
- Models Media Kit
- Singers EPK
Out of stock
Features
- Promotional Brochure
- Informational Brochure
- Event Brochure
- Brochure For Students
- Healthcare Brochure
10 in stock
Features
- Album Cover Art
- Single Cover Art
- Abstract Cover Art
- Podcast Album Cover
- Spotify Cover
- EPs Cover Art
- Psychedelic Cover Art
- Rock Cover Art
Out of stock
Features
- TV Show Synopsis Design
- TV Series Synopsis Design
- Movie Synopsis Design
Out of stock
Features
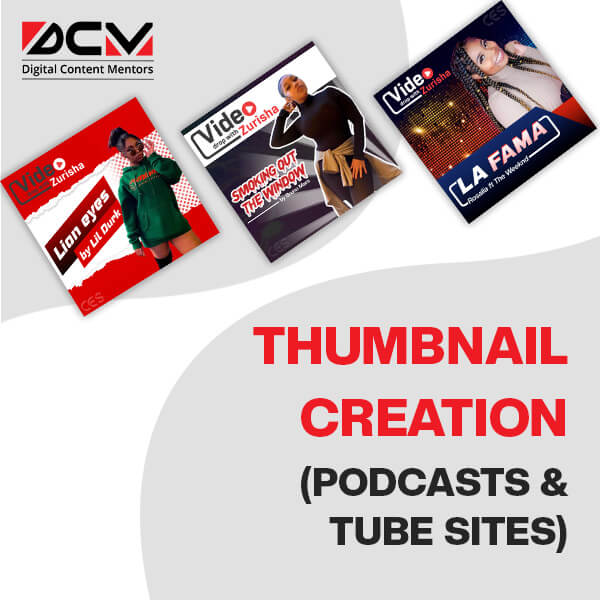
- YouTube Video Thumbnail
- Podcast Thumbnail
- 1920×1080 Standard Thumbnail
- Get Premium Images
Out of stock
Features
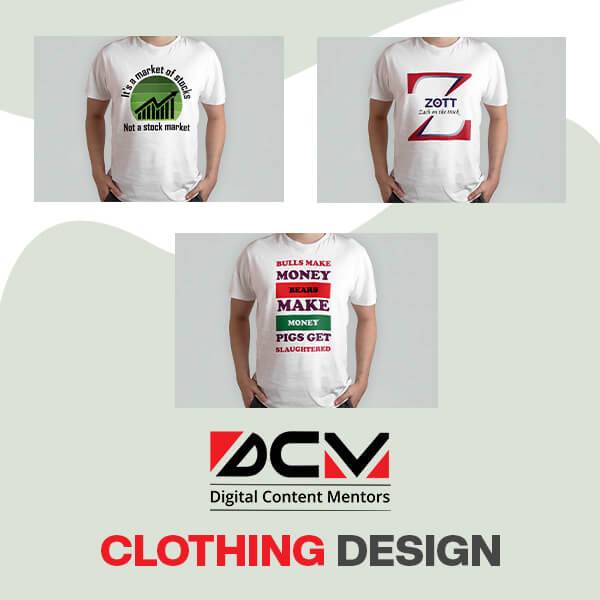
- 3D Garment Design
- Apparel Flat Sketches (Front & Back)
- T-Shirt Design
- Polo Shirt Design
- Tank Top Design
- Sweat Hoodie Design
- Jacket Design
- Jogger Design
- Shorts Design
10 in stock
Features
- Product Launch Countdown
- Service Launch Countdown
- Event Launch Countdown
- Book Launch Countdown
- Release Date Countdown
- Music Launch Countdown
- Website Launch Countdown
Out of stock
Features
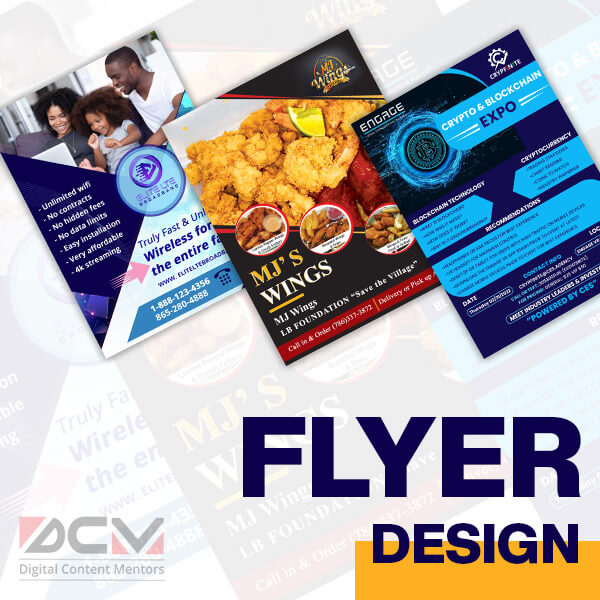
- Event Flyer Design
- Product Flyers
- Service Flyers
- Political Campaign Flyer Design
- Recruitment Purpose Flyers
Out of stock
Features
- Box Packaging
- Mailer Box
- Auto-lock Box
- Shipping Box
- Kraft Box
- Product packaging
- Subscription box
- Tuck-End Box
- Product Label
- Retail Box
- Display Box
- 3d Mockups
- Magnetic box
- Shipping bag etc
Features
- Electronic Press Media Kit (EPK) Design
- Influencer Kit
- Speaker Kit
- Business Kit
- Press Kit
- Actor Kit
- Artist Media Kit
Out of stock
Features
- Financial Statement Design
- Personal Statement Design
- Company Mission Statement Design
- Product Statement Design
- Marketing Statement Design
Features
- Magazine Layout Design
- Magazine Cover Design
- Book Cover Design
- Book Layout Design
- Newspaper Layout Design
Out of stock
Florida
California
New York City
Texas
London
Atlanta
Las Vegas
Detroit
Chicago
WhatsApp us
Select at least 2 products
to compare

